Back
Case Study 02 · Marketing Analytics

Where should $11.1M of ad spend actually go?

A triage framework that classifies every campaign across Google, Meta & TikTok, and surfaces the few that warrant action.

RoleFramework design & analysis
ToolsBigQuery · Tableau · SQL
Scope1,800 campaigns
DateMay 2026
TL;DR

A Scale / Kill / Fix / Maintain framework, applied to a 1,800-campaign synthetic portfolio worth $11.1M. The headline illustration: more budget flows to Kill ($1.63M) than to Scale ($1.43M), Google is the cleanup priority, and TikTok is under-allocated despite a 13.1× ROAS. The deliverable is the framework itself — portable to any real ad portfolio with ROAS, spend, and CPA in the data.

The problem

Marketing ops leads sit with portfolios of dozens or hundreds of campaigns across platforms. Which deserve more budget, which to pause, which to investigate? Without a framework, those calls drift into intuition, recency bias, or whoever spoke up last. The opportunity: replace intuition with one set of rules applied to every campaign, surfacing only the few that warrant action.

The framework

Designed before any code. Four thresholds capture decisions a marketing manager would defend in front of a CFO, all platform-relative, since Google, Meta and TikTok have structurally different baselines.

Scale

Profitable + headroom

ROAS ≥ 3.0 and spend below platform median.

Kill

Confirmed losers

ROAS < 1.0 & mature, or CPA > 3× median with weak ROAS.

Fix

Funnel imbalance

Landing-page, creative, or audience issue.

Maintain

Default

Doesn't trigger any rule.

The classification runs in BigQuery as a single query with four CTEs: per-campaign metrics, platform benchmarks, an enriched join, and a CASE statement applying the rules in precedence order (Kill → Scale → Fix → Maintain).

ROAS variance check across campaigns, confirming the synthetic dataset has realistic spread before building the triage framework on it
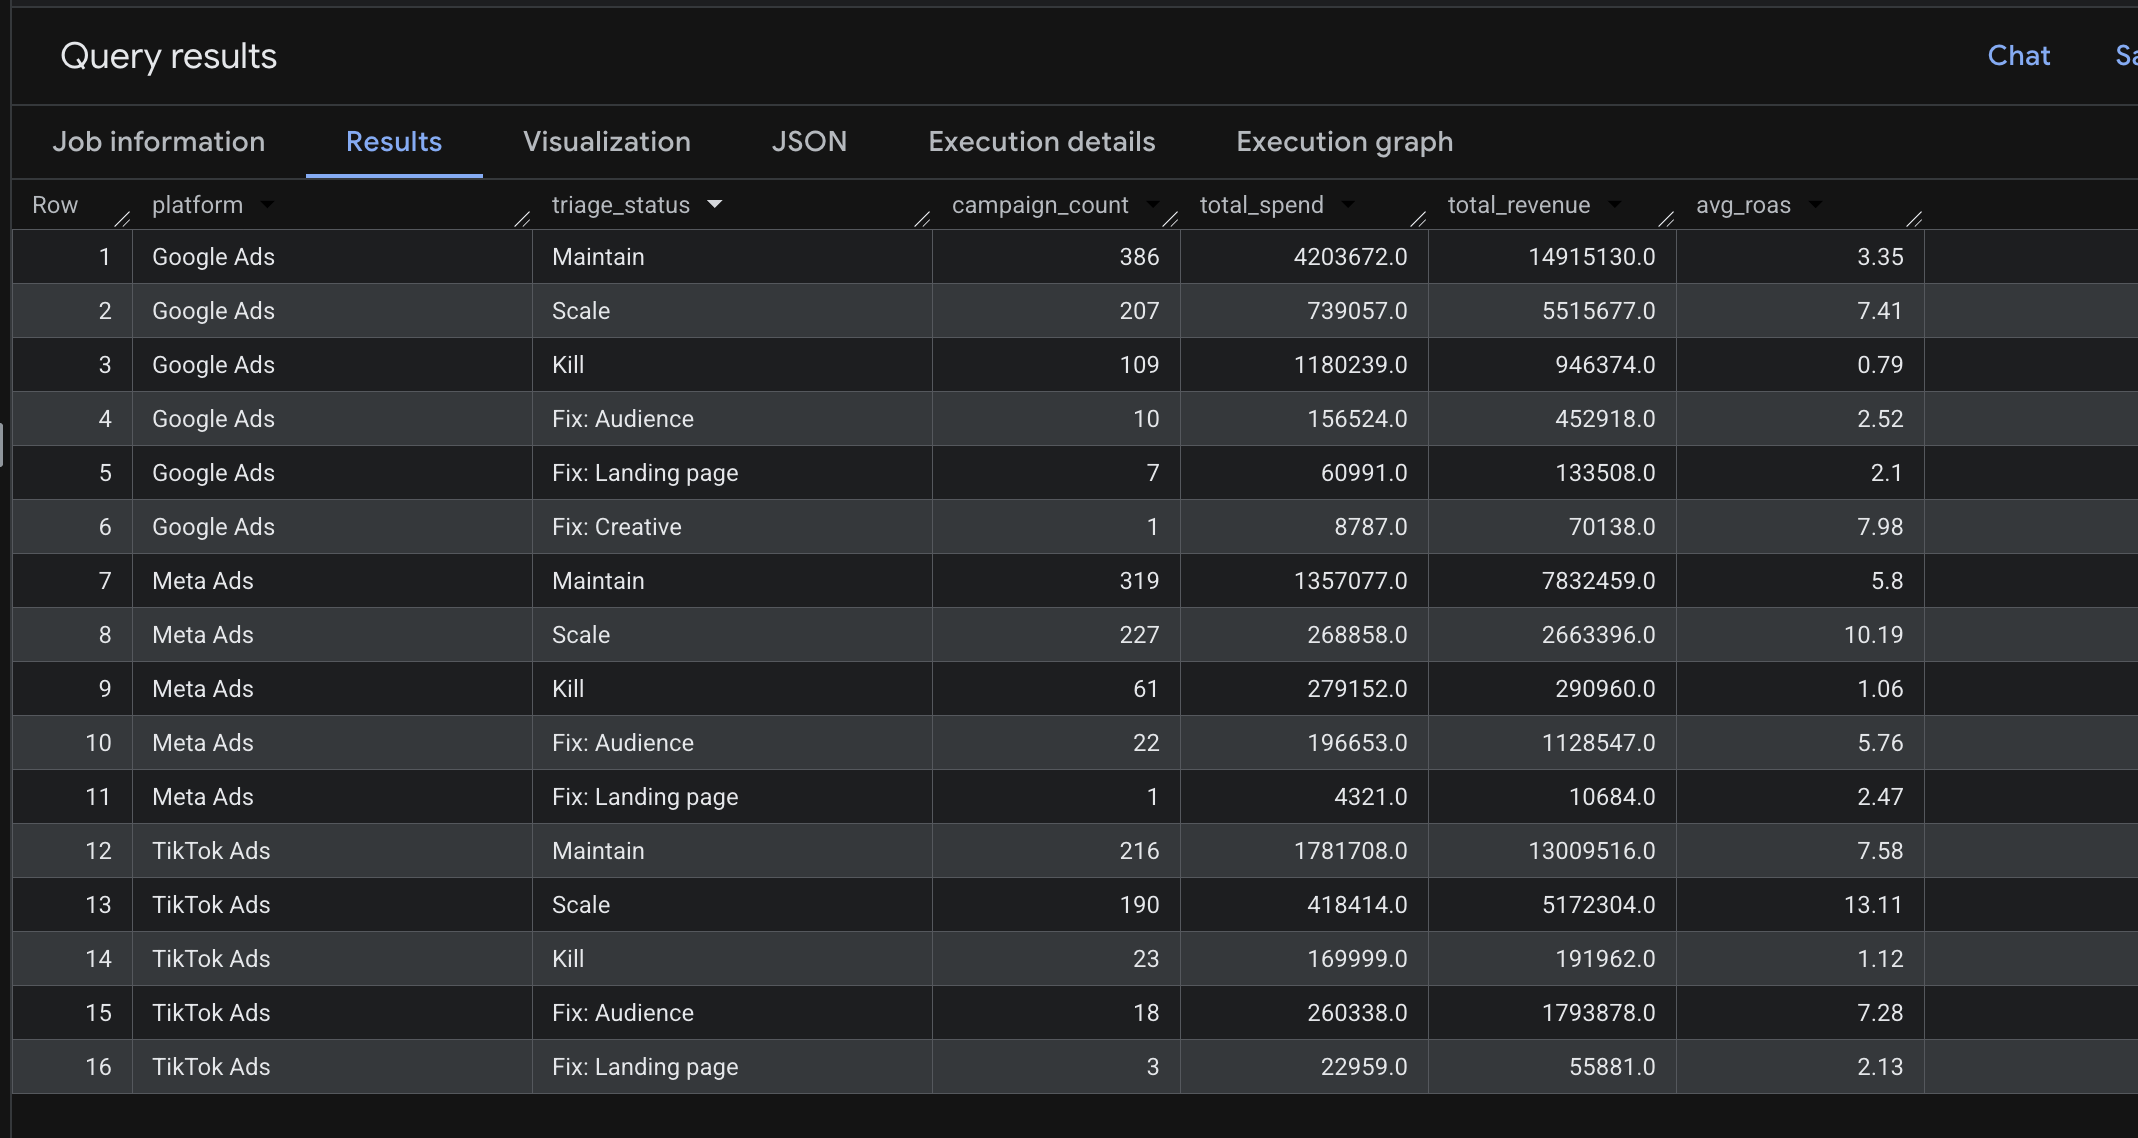
Triage distribution: how the 1,800 campaigns split across Scale, Kill, Fix, and Maintain by platform

Key findings

$1.63M
flows to Kill campaigns, more than the $1.43M going to Scale candidates.
6.9×
more at-risk spend in Google's Kill bucket than TikTok's.
13.1×
average ROAS on TikTok Scale campaigns, yet under half the Scale budget.
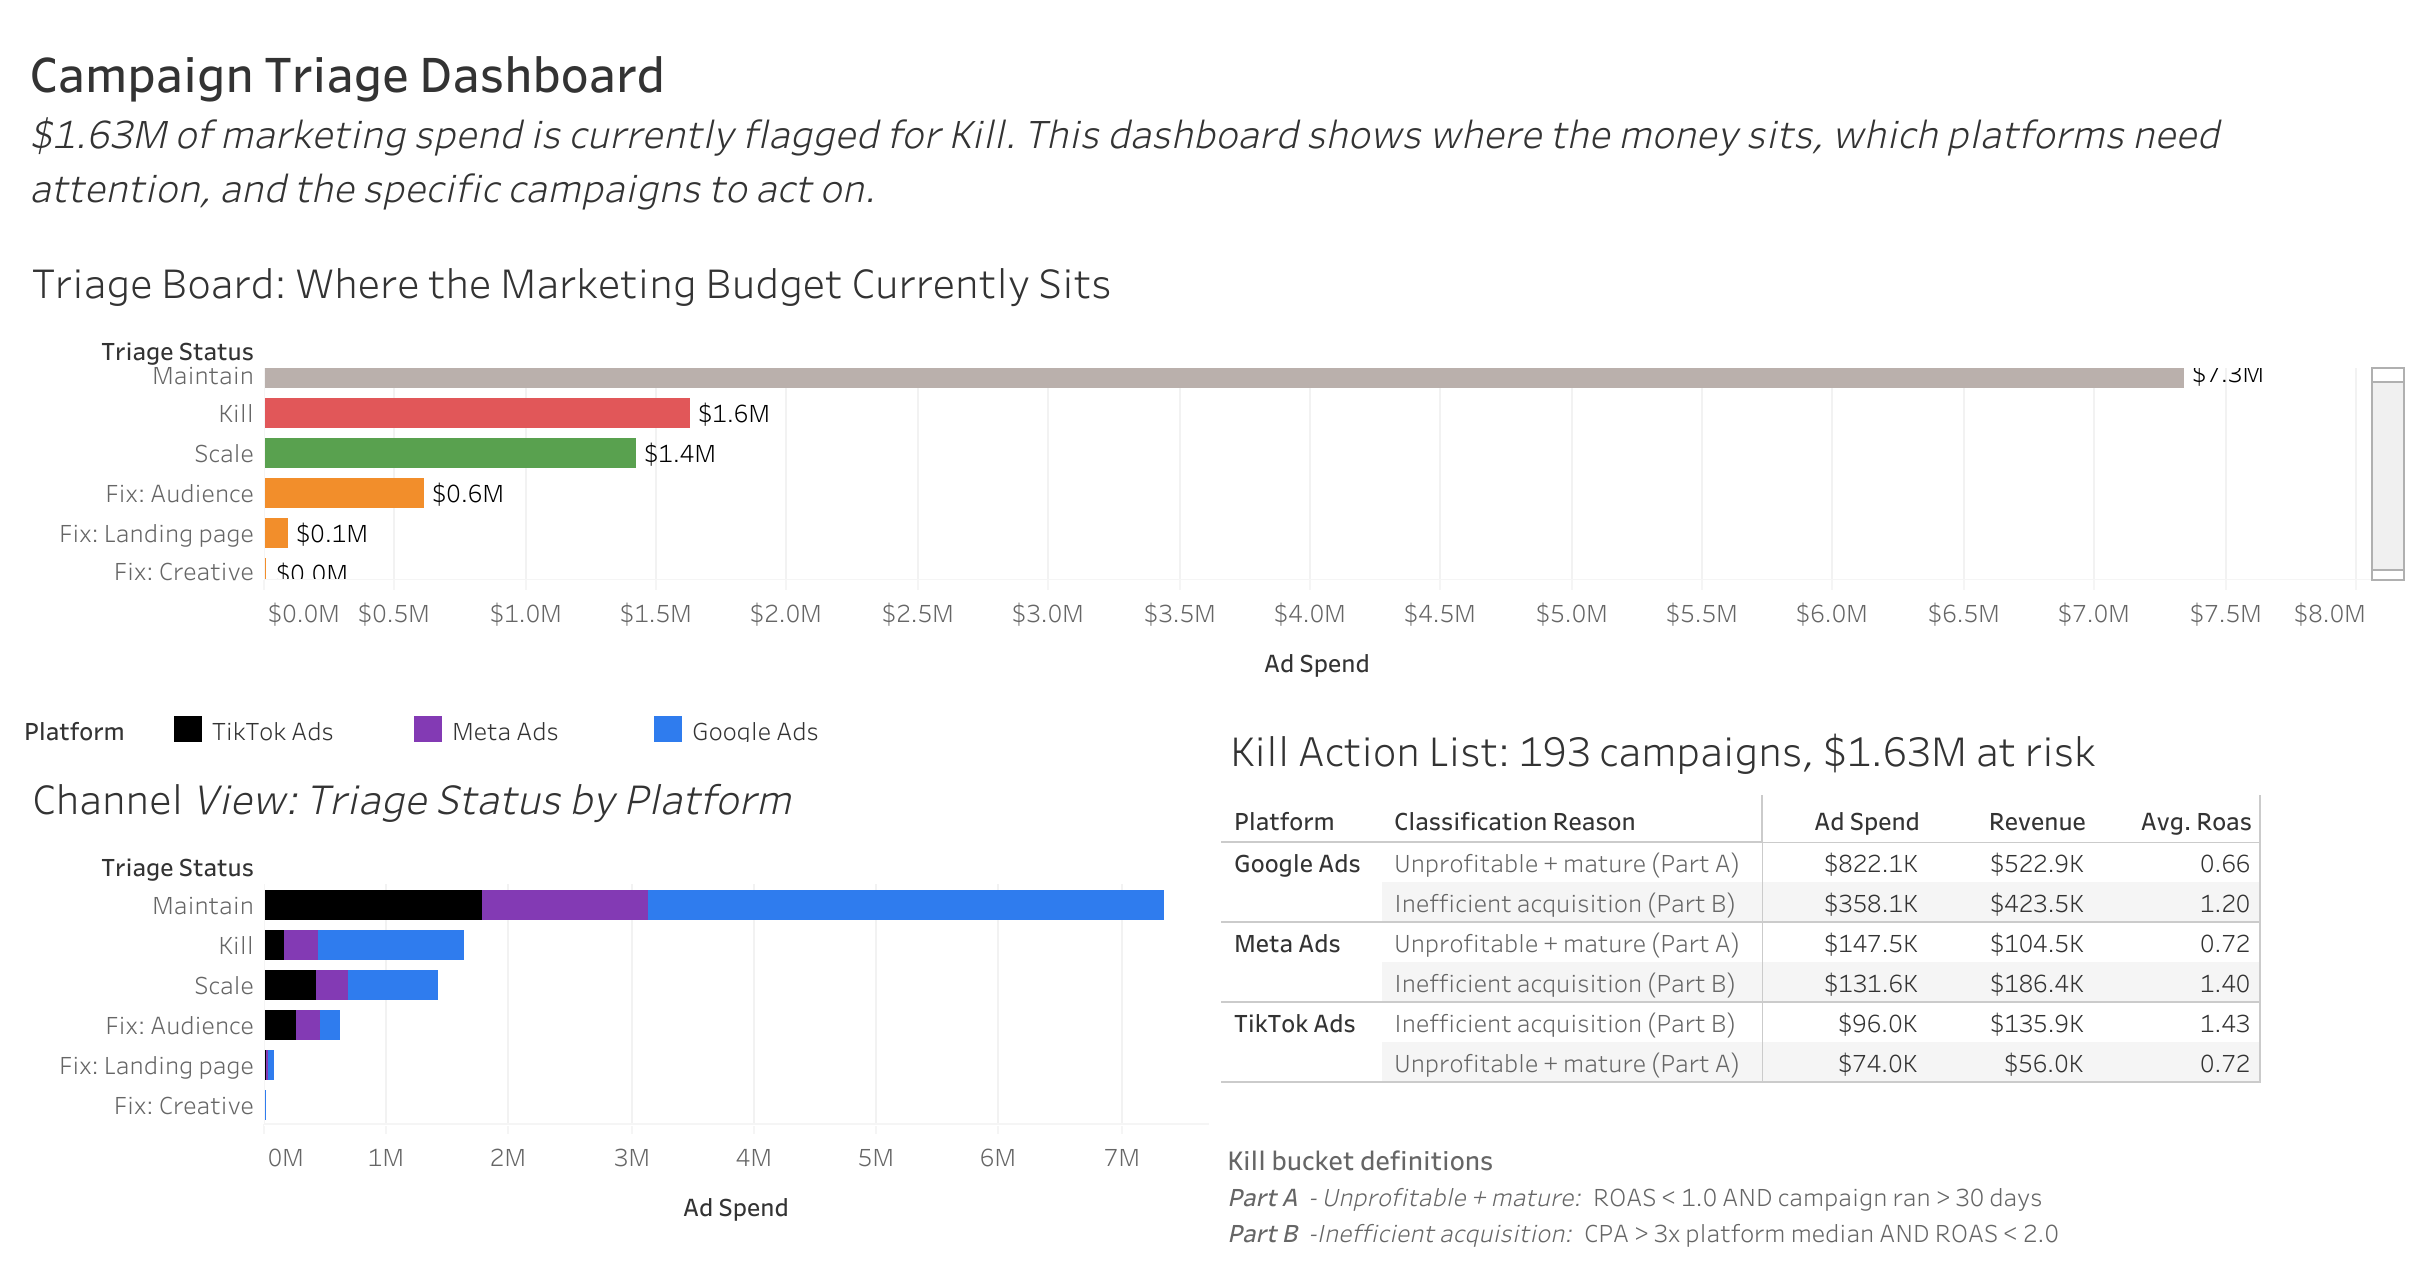
Campaign Triage Dashboard in Tableau: $1.63M flagged for Kill, with budget by triage status, channel view by platform, and a Kill action list of 193 campaigns

The portfolio has more money on losers than on growth

Of $11.1M total spend, more flows to confirmed-losing campaigns than to growth opportunities. The single clearest signal that the framework surfaces.

Google is the cleanup priority

Google holds 109 of 193 Kill campaigns and $1.18M of at-risk spend, with the only sub-1.0 average ROAS. These aren't borderline. They're confirmed losers.

TikTok is under-allocated relative to performance

TikTok Scale campaigns return 77% higher ROAS than Google's, but receive less than half the Scale budget. Paused Google Kill budget could be redirected here. A clear reallocation opportunity.

How AI was used as leverage

SQL is table stakes in 2026. Anyone can ask an AI for a CASE statement. What makes a framework usable is judgment: which thresholds, why, and what happens at the boundaries. AI was a sounding board for debating thresholds ("why 3.0x and not 2.5x?"), it reinforced the sanity-check discipline that caught a flat synthetic dataset before I built on it, and it accelerated documentation. The judgment work stayed mine; AI handled the mechanical parts.

Honest caveats

Next: industry-aware thresholds, a budget-reallocation simulator, near-threshold flagging, and real multi-touch attribution.